
Page 152 - Genetics_From_Genes_to_Genomes_6th_FULL_Part1
P. 152
144 Chapter 5 Linkage, Recombination, and the Mapping of Genes on Chromosomes
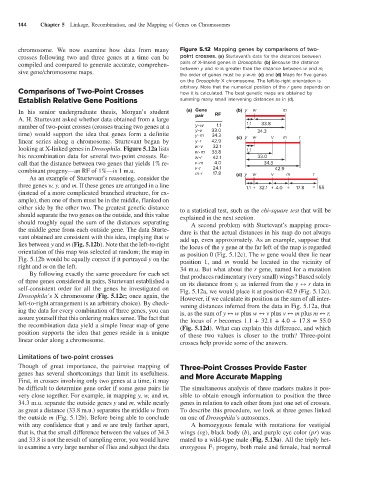
chromosome. We now examine how data from many Figure 5.12 Mapping genes by comparisons of two-
crosses following two and three genes at a time can be point crosses. (a) Sturtevant’s data for the distances between
compiled and compared to generate accurate, comprehen- pairs of X-linked genes in Drosophila. (b) Because the distance
sive gene/chromosome maps. between y and m is greater than the distance between w and m,
the order of genes must be y-w-m. (c) and (d) Maps for five genes
on the Drosophila X chromosome. The left-to-right orientation is
arbitrary. Note that the numerical position of the r gene depends on
Comparisons of Two-Point Crosses how it is calculated. The best genetic maps are obtained by
Establish Relative Gene Positions summing many small intervening distances as in (d).
In his senior undergraduate thesis, Morgan’s student (a) Gene RF (b) y w m
A. H. Sturtevant asked whether data obtained from a large pair
number of two-point crosses (crosses tracing two genes at a y-w 1.1 1.1 33.8
time) would support the idea that genes form a definite y-v 33.0 (c) y w 34.3 v m r
y-m
34.3
linear series along a chromosome. Sturtevant began by y-r 42.9
32.1
looking at X-linked genes in Drosophila. Figure 5.12a lists w -v 33.8 1.1
w-m
his recombination data for several two-point crosses. Re- w-r 42.1 33.0
call that the distance between two genes that yields 1% re- v-m 4.0 34.3
combinant progeny—an RF of 1%—is 1 m.u. v-r 24.1 42.9
m-r
17.8
As an example of Sturtevant’s reasoning, consider the (d) y w v m r
three genes w, y, and m. If these genes are arranged in a line 1.1 + 32.1 + 4.0 + 17.8 = 55
(instead of a more complicated branched structure, for ex-
ample), then one of them must be in the middle, flanked on
either side by the other two. The greatest genetic distance to a statistical test, such as the chi-square test that will be
should separate the two genes on the outside, and this value explained in the next section.
should roughly equal the sum of the distances separating A second problem with Sturtevant’s mapping proce-
the middle gene from each outside gene. The data Sturte- dure is that the actual distances in his map do not always
vant obtained are consistent with this idea, implying that w add up, even approximately. As an example, suppose that
lies between y and m (Fig. 5.12b). Note that the left-to-right the locus of the y gene at the far left of the map is regarded
orientation of this map was selected at random; the map in as position 0 (Fig. 5.12c). The w gene would then lie near
Fig. 5.12b would be equally correct if it portrayed y on the position 1, and m would be located in the vicinity of
right and m on the left. 34 m.u. But what about the r gene, named for a mutation
By following exactly the same procedure for each set that produces rudimentary (very small) wings? Based solely
of three genes considered in pairs, Sturtevant established a on its distance from y, as inferred from the y ↔ r data in
self-consistent order for all the genes he investigated on Fig. 5.12a, we would place it at position 42.9 (Fig. 5.12c).
Drosophila’s X chromosome (Fig. 5.12c; once again, the However, if we calculate its position as the sum of all inter-
left-to-right arrangement is an arbitrary choice). By check- vening distances inferred from the data in Fig. 5.12a, that
ing the data for every combination of three genes, you can is, as the sum of y ↔ w plus w ↔ v plus v ↔ m plus m ↔ r,
assure yourself that this ordering makes sense. The fact that the locus of r becomes 1.1 + 32.1 + 4.0 + 17.8 = 55.0
the recombination data yield a simple linear map of gene (Fig. 5.12d). What can explain this difference, and which
position supports the idea that genes reside in a unique of these two values is closer to the truth? Three-point
linear order along a chromosome. crosses help provide some of the answers.
Limitations of two-point crosses
Though of great importance, the pairwise mapping of Three-Point Crosses Provide Faster
genes has several shortcomings that limit its usefulness. and More Accurate Mapping
First, in crosses involving only two genes at a time, it may
be difficult to determine gene order if some gene pairs lie The simultaneous analysis of three markers makes it pos-
very close together. For example, in mapping y, w, and m, sible to obtain enough information to position the three
34.3 m.u. separate the outside genes y and m, while nearly genes in relation to each other from just one set of crosses.
as great a distance (33.8 m.u.) separates the middle w from To describe this procedure, we look at three genes linked
the outside m (Fig. 5.12b). Before being able to conclude on one of Drosophila’s autosomes.
with any confidence that y and m are truly farther apart, A homozygous female with mutations for vestigial
that is, that the small difference between the values of 34.3 wings (vg), black body (b), and purple eye color (pr) was
and 33.8 is not the result of sampling error, you would have mated to a wild-type male (Fig. 5.13a). All the triply het-
to examine a very large number of flies and subject the data erozygous F 1 progeny, both male and female, had normal