
Page 157 - Genetics_From_Genes_to_Genomes_6th_FULL_Part1
P. 157
5.3 Mapping: Locating Genes Along a Chromosome 149
genes, and therefore an underestimation of the distance be- measure of the physical distance. The two graphs then
tween them. This is not much of a problem when two genes diverge increasingly from each other, so the RF becomes
are close enough together that DCOs take place infre- a less precise estimate at genetic distances greater than
quently. However, as the distance between two genes in- 5 m.u.
creases, double and multiple crossovers occur often enough Geneticists have developed mathematical equations
to affect the relationship between recombination frequency called mapping functions to compensate for the inaccura-
and map distance. This relationship cannot be linear be- cies inherent in relating recombination frequencies to phys-
cause, as we have already seen, the RF for a two-point cross ical distances. However, the corrections for large distances
cannot exceed 50% regardless of how far apart two genes are at best imprecise because mapping functions are based
are on the same chromosome. on simplifying assumptions that are not completely true.
A second look at Fig. 5.11 makes it easy to see how Thus, the best way to create an accurate map is by summing
DCOs result in underestimation of gene distances by RF. many smaller intervals, locating widely separated genes
When genes A and B are close together, most meioses are through linkage to common intermediaries. Maps are sub-
NCOs, and the occasional meiosis is an SCO. Each SCO ject to continual refinement as more and more newly
produces exactly two recombinant gametes, and so a per- discovered genes are included.
fect linear correspondence exists between the number of
crossovers and the number of recombinant gametes
(1 crossover: 2 recombinants). However, when genes A and Nonuniform crossover frequencies
B are farther apart, DCOs occur. Only one of the four Although we have been assuming thus far that crossovers
equally frequent DCOs (4-strand) preserves the linear rela- are just as likely to occur between any two base pairs along
tionship between crossovers and recombinant gametes: a chromosome, recombination is not in fact random. In
Two crossovers occur in a 4-strand DCO and four recombi- human DNA, for example, most crossovers take place in
nant gametes (2 crossovers: 4 recombinants). In contrast, so-called recombination hotspots—small regions of
the other three types of DCOs result in fewer than four re- DNA where the frequency of recombination is much
combinant gametes. higher than average. As shown in Fig. 5.17, genes with
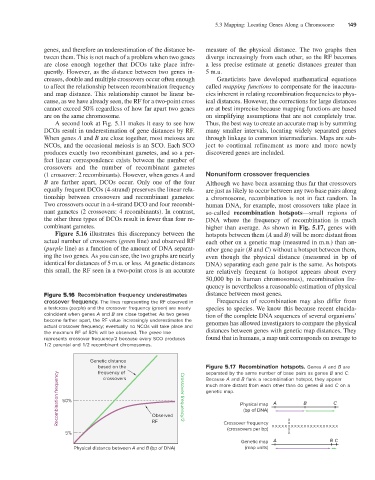
Figure 5.16 illustrates this discrepancy between the hotspots between them (A and B) will be more distant from
actual number of crossovers (green line) and observed RF each other on a genetic map (measured in m.u.) than an-
(purple line) as a function of the amount of DNA separat- other gene pair (B and C) without a hotspot between them,
ing the two genes. As you can see, the two graphs are nearly even though the physical distance (measured in bp of
identical for distances of 5 m.u. or less. At genetic distances DNA) separating each gene pair is the same. As hotspots
this small, the RF seen in a two-point cross is an accurate are relatively frequent (a hotspot appears about every
50,000 bp in human chromosomes), recombination fre-
quency is nevertheless a reasonable estimation of physical
Figure 5.16 Recombination frequency underestimates distance between most genes.
crossover frequency. The lines representing the RF observed in Frequencies of recombination may also differ from
a testcross (purple) and the crossover frequency (green) are nearly species to species. We know this because recent elucida-
coincident when genes A and B are close together. As two genes tion of the complete DNA sequences of several organisms’
become farther apart, the RF value increasingly underestimates the genomes has allowed investigators to compare the physical
actual crossover frequency; eventually no NCOs will take place and distances between genes with genetic map distances. They
the maximum RF of 50% will be observed. The green line
represents crossover frequency/2 because every SCO produces found that in humans, a map unit corresponds on average to
1/2 parental and 1/2 recombinant chromosomes.
Genetic distance
based on the Figure 5.17 Recombination hotspots. Genes A and B are
frequency of
separated by the same number of base pairs as genes B and C.
Recombination frequency 50% Crossover frequency/2 much more distant from each other than do genes B and C on a
crossovers
Because A and B flank a recombination hotspot, they appear
genetic map.
A
C
B
Physical map
(bp of DNA)
Observed
X
RF
Crossover frequency
X
(crossovers per bp) XXXXXXXXXXXXXXXXXXXXX
X
5% X
Genetic map A B C
Physical distance between A and B (bp of DNA) (map units)