
Page 156 - Genetics_From_Genes_to_Genomes_6th_FULL_Part1
P. 156
148 Chapter 5 Linkage, Recombination, and the Mapping of Genes on Chromosomes
+
pr b . In these individuals, the alleles of the vg and b genes females. In each row of the figure’s table, the genes
+
+
retain their parental associations (vg b and vg b ), while appear in an arbitrary order that does not presuppose
the pr gene has recombined with respect to both the other knowledge of the actual map. As you can see, the two
+
+
+
+
genes (pr b and pr b, vg pr and vg pr). The same is true classes of progeny listed at the top of the table outnumber
in all three-point crosses: In those gametes formed by dou- the remaining six classes, which indicates that all three
ble crossovers, the gene whose alleles have recombined genes are linked to each other. Moreover, these largest
relative to the parental configurations of the other two groups, which are the parental classes, show that the two X
+
+
genes must be the one in the middle. chromosomes of the heterozygous females were w y m
+
and w y m .
Among the male progeny in Fig. 5.15, the two smallest
Three-Point Crosses: A Comprehensive classes, representing the double crossovers, have X chro-
Example mosomes carrying w y m and w y m combinations, in
+
+
+
The technique of looking at double recombinants to dis- which the w alleles are recombined relative to those of y
cover which gene has recombined with respect to both and m. The w gene must therefore lie between y and m,
other genes allows immediate clarification of gene order verifying Sturtevant’s original assessment.
even in otherwise difficult cases. Consider the three X- To complete a map based on the w y m three-point cross,
linked genes y, w, and m that Sturtevant located in his orig- you can calculate the interval between y and w (region 1)
inal mapping experiment (see Fig. 5.12). Because the 49 + 41 + 1 + 2
distance between y and m (34.3 m.u.) appeared slightly 6823 × 100 = 1.3 m.u.
larger than the distance separating w and m (33.8 m.u.), he
concluded that w was the gene in the middle. But because as well as the interval between w and m (region 2)
of the small difference between the two numbers, his con- 1203 + 1092 + 2 + 1
clusion was subject to questions of statistical significance. × 100 = 33.7 m.u.
If, however, we look at a three-point cross following y, w, 6823
and m, these questions disappear. The genetic distance separating y and m is the sum of
Figure 5.15 tabulates the classes and numbers of
male progeny arising from females heterozygous for the y, 1.3 + 33.7 = 35.0 m.u.
w, and m genes. Because these male progeny receive their Note that you could also calculate the distance between y
only X chromosome from their mothers, their phenotypes and m directly by including double crossovers twice, to ac-
indicate directly the gametes produced by the heterozygous count for the total number of recombination events detected
between these two genes.
RF = (1203 + 1092 + 49 + 41 + 2 + 2 + 1 + 1)/6823 × 100
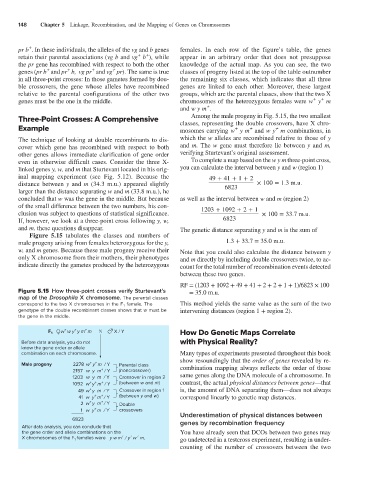
Figure 5.15 How three-point crosses verify Sturtevant’s = 35.0 m.u.
map of the Drosophila X chromosome. The parental classes
correspond to the two X chromosomes in the F 1 female. The This method yields the same value as the sum of the two
genotype of the double recombinant classes shows that w must be intervening distances (region 1 + region 2).
the gene in the middle.
+
+
+
F 1 w w y y m m X / Y How Do Genetic Maps Correlate
Before data analysis, you do not with Physical Reality?
know the gene order or allele
combination on each chromosome. Many types of experiments presented throughout this book
show resoundingly that the order of genes revealed by re-
+ +
Male progeny 2278 w y m / Y Parental class combination mapping always reflects the order of those
+
2157 w y m / Y (noncrossover)
1203 w y m / Y Crossover in region 2 same genes along the DNA molecule of a chromosome. In
+
+ +
1092 w y m / Y (between w and m) contrast, the actual physical distances between genes—that
+
49 w y m / Y Crossover in region 1 is, the amount of DNA separating them—does not always
+
+
41 w y m / Y (between y and w) correspond linearly to genetic map distances.
+
+
2 w y m / Y Double
+
1 w y m / Y crossovers
Underestimation of physical distances between
6823 genes by recombination frequency
After data analysis, you can conclude that
the gene order and allele combinations on the You have already seen that DCOs between two genes may
+
+
+
X chromosomes of the F females were y w m / y w m. go undetected in a testcross experiment, resulting in under-
1
counting of the number of crossovers between the two