
Page 30 - Genetics_From_Genes_to_Genomes_6th_FULL_Part2
P. 30
6.2 The Watson and Crick Double Helix Model of DNA 189
other end of the chain—the 3′ end—it is the 3′ carbon of the published their findings in the scientific journal Nature in
final nucleotide that is free. Along the chain between the two April 1953.
ends, this 5′-to-3′ polarity is conserved from nucleotide to
nucleotide. By convention, a DNA chain is described in
terms of its bases, written with the 5′-to-3′ direction going Evidence from X-ray diffraction
from left to right (unless otherwise noted). The chain The diffraction patterns of oriented DNA fibers do not, on
depicted in Fig. 6.9c, for instance, would be 5′ TACG 3′. their own, contain sufficient information to reveal structure.
For instance, the number of diffraction spots, whose intensi-
ties and positions constitute the X-ray data (review Fig. 6.8), is
DNA’s information content considerably lower than the number of unknown coordinates
Information can be encoded only in a sequence of symbols of all the atoms in an oriented DNA molecule. Nevertheless,
whose order varies according to the message to be conveyed. the photographs do reveal a wealth of structural information to
Without this sequence variation, there is no potential for car- the trained eye. Excellent X-ray images produced by Rosalind
rying information. Because DNA’s backbone of alternating Franklin and Maurice Wilkins showed that the molecule is
sugar and phosphate is chemically identical for every nucle- spiral-shaped, or helical; the spacing between repeating units
otide in a DNA chain, the only difference between nucleo- along the axis of the helix is 3.4 Å (3.4 × 10 −10 meters); the
tides is in the identity of the nitrogenous base. Thus, the helix undergoes one complete turn every 34 Å; and the diam-
genetic information in DNA must consist of variations in the eter of the molecule is 20 Å. This diameter is roughly twice the
sequence of the A, G, T, and C bases. The information con- width of a single nucleotide, suggesting that a DNA molecule
structed from the four-letter language of DNA bases is anal- might be composed of two side-by-side DNA chains.
ogous to the information built from the 26-letter alphabet of
English or French or Italian. Just as you can combine the
26 letters of the alphabet in different ways to generate the Complementary base pairing
words of a book, so, too, different combinations of the four If a DNA molecule contains two side-by-side chains of
bases in very long sequences of nucleotides can encode the nucleotides, what forces hold these chains together? Erwin
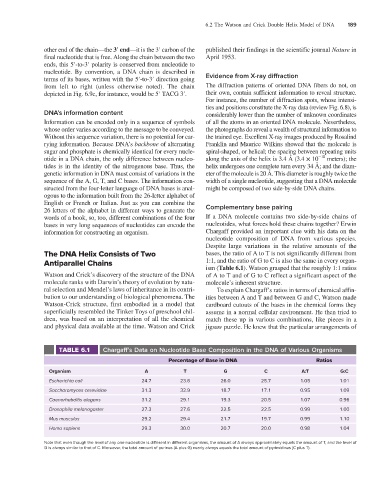
information for constructing an organism. Chargaff provided an important clue with his data on the
nucleotide composition of DNA from various species.
Despite large variations in the relative amounts of the
The DNA Helix Consists of Two bases, the ratio of A to T is not significantly different from
Antiparallel Chains 1:1, and the ratio of G to C is also the same in every organ-
ism (Table 6.1). Watson grasped that the roughly 1:1 ratios
Watson and Crick’s discovery of the structure of the DNA of A to T and of G to C reflect a significant aspect of the
molecule ranks with Darwin’s theory of evolution by natu- molecule’s inherent structure.
ral selection and Mendel’s laws of inheritance in its contri- To explain Chargaff’s ratios in terms of chemical affin-
bution to our understanding of biological phenomena. The ities between A and T and between G and C, Watson made
Watson-Crick structure, first embodied in a model that cardboard cutouts of the bases in the chemical forms they
superficially resembled the Tinker Toys of preschool chil- assume in a normal cellular environment. He then tried to
dren, was based on an interpretation of all the chemical match these up in various combinations, like pieces in a
and physical data available at the time. Watson and Crick jigsaw puzzle. He knew that the particular arrangements of
TABLE 6.1 Chargaff’s Data on Nucleotide Base Composition in the DNA of Various Organisms
Percentage of Base in DNA Ratios
Organism A T G C A:T G:C
Escherichia coli 24.7 23.6 26.0 25.7 1.05 1.01
Saccharomyces cerevisiae 31.3 32.9 18.7 17.1 0.95 1.09
Caenorhabditis elegans 31.2 29.1 19.3 20.5 1.07 0.96
Drosophila melanogaster 27.3 27.6 22.5 22.5 0.99 1.00
Mus musculus 29.2 29.4 21.7 19.7 0.99 1.10
Homo sapiens 29.3 30.0 20.7 20.0 0.98 1.04
Note that even though the level of any one nucleotide is different in different organisms, the amount of A always approximately equals the amount of T, and the level of
G is always similar to that of C. Moreover, the total amount of purines (A plus G) nearly always equals the total amount of pyrimidines (C plus T).