
Page 85 - Genetics_From_Genes_to_Genomes_6th_FULL_Part3
P. 85
11.3 Sampling DNA Variation in a Genome 379
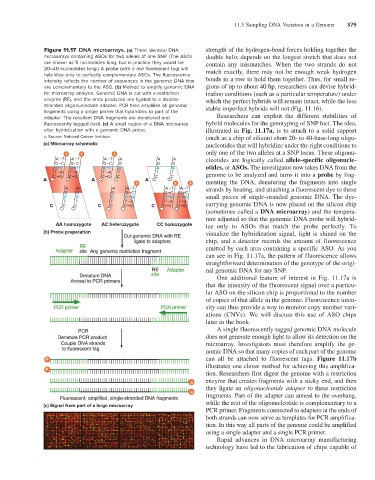
Figure 11.17 DNA microarrays. (a) Three identical DNA strength of the hydrogen-bond forces holding together the
microarrays containing ASOs for two alleles of one SNP. (The ASOs double helix depends on the longest stretch that does not
are shown as 5 nucleotides long, but in practice they would be contain any mismatches. When the two strands do not
20–40 nucleotides long.) A probe (with a red fluorescent tag) will match exactly, there may not be enough weak hydrogen
hybridize only to perfectly complementary ASOs. The fluorescence
intensity reflects the number of sequences in the genomic DNA that bonds in a row to hold them together. Thus, for small re-
are complementary to the ASO. (b) Method to amplify genomic DNA gions of up to about 40 bp, researchers can devise hybrid-
for microarray analysis. Genomic DNA is cut with a restriction ization conditions (such as a particular temperature) under
enzyme (RE), and the ends produced are ligated to a double- which the perfect hybrids will remain intact, while the less
stranded oligonucleotide adapter. PCR then amplifies all genomic stable imperfect hybrids will not (Fig. 11.16).
fragments using a single primer that hybridizes to part of the
adapter. The resultant DNA fragments are denatured and Researchers can exploit the different stabilities of
fluorescently tagged (red). (c) A small region of a DNA microarray hybrid molecules for the genotyping of SNP loci. The idea,
after hybridization with a genomic DNA probe. illustrated in Fig. 11.17a, is to attach to a solid support
c: Source: National Cancer Institute (such as a chip of silicon) short 20- to 40-base-long oligo-
(a) Microarray schematic nucleotides that will hybridize under the right conditions to
only one of the two alleles at a SNP locus. These oligonu-
A T A T A T A A A cleotides are logically called allele-specific oligonucle-
G C G C G C G G G
A T A T A T A A A otides, or ASOs. The investigator now takes DNA from the
T A T A T A T T T genome to be analyzed and turns it into a probe by frag-
C G C G C G C C C
A A A menting the DNA, denaturing the fragments into single
A A A A T A T A T strands by heating, and attaching a fluorescent dye to these
G G G G C G C G C
C C C C G C G C G small pieces of single-stranded genomic DNA. The dye-
T T T T A T A T A
C C C C C C G C C G C G carrying genomic DNA is now placed on the silicon chip
(sometimes called a DNA microarray) and the tempera-
ture adjusted so that the genomic DNA probe will hybrid-
AA homozygote AC heterozygote CC homozygote ize only to ASOs that match the probe perfectly. To
(b) Probe preparation visualize the hybridization signal, light is shined on the
chip, and a detector records the amount of fluorescence
emitted by each area containing a specific ASO. As you
can see in Fig. 11.17a, the pattern of fluorescence allows
straightforward determination of the genotype of the origi-
nal genomic DNA for any SNP.
One additional feature of interest in Fig. 11.17a is
that the intensity of the fluorescent signal over a particu-
lar ASO on the silicon chip is proportional to the number
of copies of that allele in the genome. Fluorescence inten-
sity can thus provide a way to monitor copy number vari-
ations (CNVs). We will discuss this use of ASO chips
later in the book.
A single fluorescently-tagged genomic DNA molecule
does not generate enough light to allow its detection on the
microarray. Investigators must therefore amplify the ge-
nomic DNA so that many copies of each part of the genome
can all be attached to fluorescent tags. Figure 11.17b
illustrates one clever method for achieving this amplifica-
tion. Researchers first digest the genome with a restriction
enzyme that creates fragments with a sticky end, and then
they ligate an oligonucleotide adapter to these restriction
fragments. Part of the adapter can anneal to the overhang,
while the rest of the oligonucleotide is complementary to a
(c) Signal from part of a large microarray
PCR primer. Fragments connected to adapters at the ends of
both strands can now serve as templates for PCR amplifica-
tion. In this way all parts of the genome could be amplified
using a single adapter and a single PCR primer.
Rapid advances in DNA microarray manufacturing
technology have led to the fabrication of chips capable of