
Page 145 - Genetics_From_Genes_to_Genomes_6th_FULL_Part1
P. 145
5.1 Gene Linkage and Recombination 137
dominant and one recessive allele. Mendel observed the of F 2 would have increased at the expense of the two 3/16
9:3:3:1 phenotypic ratio in the F 2 of his dihybrid crosses classes. Conversely, if the alleles of the parents are config-
because the four possible gamete types (A B, A b, A B, and ured differently (A b / A b × a B / a B) and the F 1 are there-
a b) were produced at equal frequency by both parents. fore A b / a B, then the two 3/16 genotypic classes would
Equal numbers of each of the four gamete types— increase at the expense of the 9/16 and 1/16 classes (not
independent assortment—means that each one of the shown). Linkage thus undoes the basis of the 9:3:3:1 ratio.
16 boxes in the Punnett square for the F 2 is an equally likely Unequal numbers of the four gamete types are produced, so
fertilization with a frequency of 1/16 (recall Fig. 2.15). each box of the Punnett square in Fig. 5.4 no longer repre-
Had Mendel’s two genes been linked, the phenotypic sents an equally likely fertilization.
ratio in the F 2 would no longer have been 9:3:3:1 because
the parental gametes would have been present at greater
frequency than the recombinant gametes. Figure 5.4 shows Testcrosses Simplify the Detection
the consequences of linkage if the F 1 dihybrid individuals of Linkage
were both of genotype A B / a b : The 9/16 and 1/16 classes
Early twentieth-century geneticists found it difficult to
interpret crosses involving autosomal genes such as that
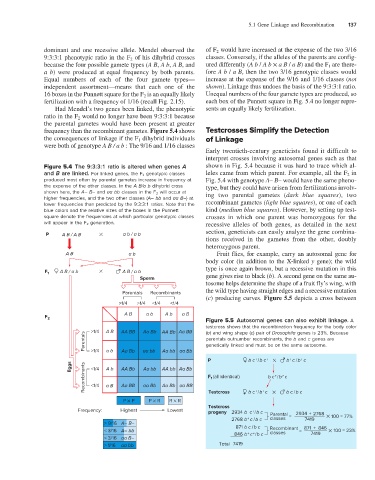
Figure 5.4 The 9:3:3:1 ratio is altered when genes A shown in Fig. 5.4 because it was hard to trace which al-
and B are linked. For linked genes, the F 2 genotypic classes leles came from which parent. For example, all the F 2 in
produced most often by parental gametes increase in frequency at Fig. 5.4 with genotype A– B– would have the same pheno-
the expense of the other classes. In the A B/a b dihybrid cross type, but they could have arisen from fertilizations involv-
shown here, the A– B– and aa bb classes in the F 2 will occur at ing two parental gametes (dark blue squares), two
higher frequencies, and the two other classes (A– bb and aa B–) at
lower frequencies than predicted by the 9:3:3:1 ratios. Note that the recombinant gametes (light blue squares), or one of each
blue colors and the relative sizes of the boxes in the Punnett kind (medium blue squares). However, by setting up test-
square denote the frequencies at which particular genotypic classes crosses in which one parent was homozygous for the
will appear in the F 2 generation. recessive alleles of both genes, as detailed in the next
section, geneticists can easily analyze the gene combina-
P A B / A B a b / a b
tions received in the gametes from the other, doubly
heterozygous parent.
A B a b Fruit flies, for example, carry an autosomal gene for
body color (in addition to the X-linked y gene); the wild
type is once again brown, but a recessive mutation in this
A B / a b A B / a b
F 1 gene gives rise to black (b). A second gene on the same au-
Sperm
tosome helps determine the shape of a fruit fly’s wing, with
the wild type having straight edges and a recessive mutation
Parentals Recombinants
(c) producing curves. Figure 5.5 depicts a cross between
>1/4 >1/4 <1/4 <1/4
A B a b A b a B
F 2
Figure 5.5 Autosomal genes can also exhibit linkage. A
testcross shows that the recombination frequency for the body color
>1/4 A B AA BB Aa Bb AA Bb Aa BB (b) and wing shape (c) pair of Drosophila genes is 23%. Because
Parentals >1/4 a b parentals outnumber recombinants, the b and c genes are
genetically linked and must be on the same autosome.
Aa Bb
Aa bb aa Bb
aa bb
+
P b c + /b c + b + c /b c
Eggs <1/4 A b AA Bb Aa bb AA bb Aa Bb
Recombinants <1/4 a B Aa BB aa Bb Aa Bb aa BB F 1 (all identical) b c + /b c
+
+
+
P × P P × R R × R Testcross b c /b c b c /b c
Testcross
Frequency: Highest Lowest progeny 2934 b c /b c Parental 2934 + 2768
+
+
2768 b c /b c classes = 7419 100 = 77%
> 9/16 A– B–
871 b c /b c Recombinant 871 + 846
< 3/16 A– bb = 100 = 23%
846 b + + classes 7419
c /b c
< 3/16 aa B–
> 1/16 aa bb Total 7419