
Page 27 - Genetics_From_Genes_to_Genomes_6th_FULL_Part3
P. 27
FEATURE FIGURE 9.3
Gel Electrophoresis
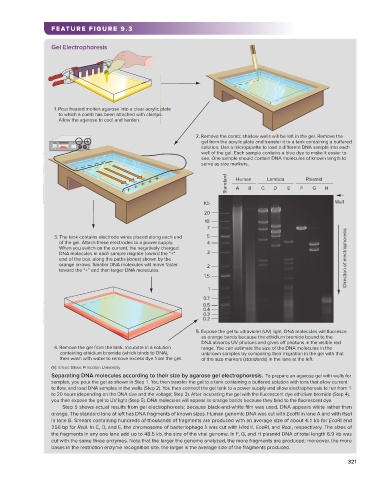
1. Pour heated molten agarose into a clear acrylic plate
to which a comb has been attached with clamps.
Allow the agarose to cool and harden.
2. Remove the comb; shallow wells will be left in the gel. Remove the
– + gel from the acrylic plate and transfer it to a tank containing a bu ered
solution. Use a micropipette to load a di erent DNA sample into each
well of the gel. Each sample contains a blue dye to make it easier to
– – – – see. One sample should contain DNA molecules of known length to
serve as size markers.
– +
B
D
G
A
+ + + + Standard Human C Lambda E F Plasmid H
Kb Well
20
10
7
3. The tank contains electrode wires placed along each end 5
of the gel. Attach these electrodes to a power supply. 4
When you switch on the current, the negatively charged
DNA molecules in each sample migrate toward the “+” 3
end of the box, along the paths (lanes) shown by the Direction of electrophoresis
orange arrows. Smaller DNA molecules will move faster 2
toward the “+” end than larger DNA molecules.
1.5
1
0.7
0.5
0.4
0.3
0.2
5. Expose the gel to ultraviolet (UV) light. DNA molecules will fluoresce
as orange bands because the ethidium bromide bound to the
DNA absorbs UV photons and gives o photons in the visible red
4. Remove the gel from the tank. Incubate in a solution range. You can estimate the size of the DNA molecules in the
containing ethidium bromide (which binds to DNA), unknown samples by comparing their migration in the gel with that
then wash with water to remove excess dye from the gel. of the size markers (standards) in the lane at the left.
(5): © Lee Silver, Princeton University
Separating DNA molecules according to their size by agarose gel electrophoresis. To prepare an agarose gel with wells for
samples, you pour the gel as shown in Step 1. You then transfer the gel to a tank containing a buffered solution with ions that allow current
to flow, and load DNA samples in the wells (Step 2). You then connect the gel tank to a power supply and allow electrophoresis to run from 1
to 20 hours (depending on the DNA size and the voltage; Step 3). After incubating the gel with the fluorescent dye ethidium bromide (Step 4),
you then expose the gel to UV light (Step 5). DNA molecules will appear as orange bands because they bind to the fluorescent dye.
Step 5 shows actual results from gel electrophoresis; because black-and-white film was used, DNA appears white rather than
orange. The standard lane at left has DNA fragments of known sizes. Human genomic DNA was cut with EcoRI in lane A and with RsaI
in lane B. Smears containing hundreds of thousands of fragments are produced with an average size of about 4.1 kb for EcoRI and
256 bp for RsaI. In C, D, and E, the chromosome of bacteriophage λ was cut with HindIII, EcoRI, and RsaI, respectively. The sizes of
the fragments in any one lane add up to 48.5 kb, the size of the viral genome. In F, G, and H plasmid DNA of total length 6.9 kb was
cut with the same three enzymes. Note that the larger the genome analyzed, the more fragments are produced; moreover, the more
bases in the restriction enzyme recognition site, the larger is the average size of the fragments produced.
321