
Page 64 - Genetics_From_Genes_to_Genomes_6th_FULL_Part1
P. 64
56 Chapter 3 Extensions to Mendel’s Laws
product of allele A as protein A (no italics), and when ap- genes interacts additively to produce the phenotype of
propriate, that of allele a as protein a (no italics). seed color in lentils.
Results obtained from self-crosses with the various
types of F 2 lentil plants support a two-gene explanation.
Additive Interactions Between Two Genes Self-crosses of F 2 green individuals show that they are
pure-breeding, producing an F 3 generation that is en-
Controlling a Single Trait Can Produce tirely green. Tan individuals generate either all tan off-
Novel Phenotypes spring, or a mixture of tan offspring and green offspring.
Grays similarly produce either all gray, or gray and
In the chapter opening, we described a mating of tan and green. Self-crosses of brown F 2 individuals can have
gray lentils that produced a uniformly brown F 1 genera- four possible outcomes: all brown, brown plus tan,
tion and then an F 2 generation containing brown, tan, brown plus gray, or all four colors (Fig. 3.10b). The two-
gray, and green lentil seeds. An understanding of how gene hypothesis explains why:
this can happen emerges from experimental results dem-
onstrating that the ratio of the four F 2 colors is 9 brown : ∙ only one green genotype exists: pure-breeding aa bb,
3 tan : 3 gray : 1 green (Fig. 3.10a). Recall from Chapter 2 but
that this is the same ratio Mendel observed in his analysis ∙ two types of tans exist: pure-breeding AA bb as well
of the F 2 generations from dihybrid crosses following as tan- and green-producing Aa bb, and
two independently assorting genes. In Mendel’s studies, ∙ two types of grays exist: pure-breeding aa BB and
each of the four classes consisted of plants that expressed gray- and green-producing aa Bb, yet
a combination of two unrelated traits. With lentils, how- ∙ four types of browns exist: true-breeding AA BB,
ever, we are looking at a single trait—seed color. The brown- and tan-producing AA Bb, brown- and gray-
simplest explanation for the parallel ratios is that a com- producing Aa BB, and Aa Bb dihybrids that give rise
bination of genotypes at two independently assorting to plants producing lentils of all four colors.
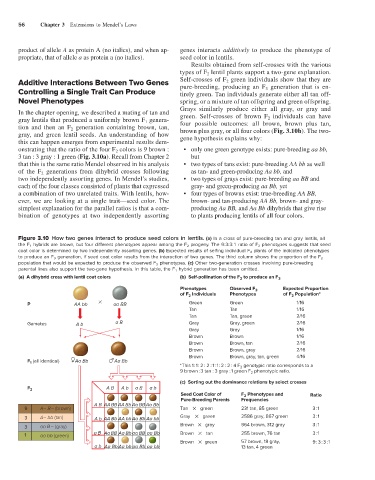
Figure 3.10 How two genes interact to produce seed colors in lentils. (a) In a cross of pure-breeding tan and gray lentils, all
the F 1 hybrids are brown, but four different phenotypes appear among the F 2 progeny. The 9:3:3:1 ratio of F 2 phenotypes suggests that seed
coat color is determined by two independently assorting genes. (b) Expected results of selfing individual F 2 plants of the indicated phenotypes
to produce an F 3 generation, if seed coat color results from the interaction of two genes. The third column shows the proportion of the F 2
population that would be expected to produce the observed F 3 phenotypes. (c) Other two-generation crosses involving pure-breeding
parental lines also support the two-gene hypothesis. In this table, the F 1 hybrid generation has been omitted.
(a) A dihybrid cross with lentil coat colors (b) Self-pollination of the F to produce an F 3
2
Phenotypes Observed F 3 Expected Proportion
of F Individuals Phenotypes of F Population*
2
2
P AA bb aa BB Green Green 1/16
Tan Tan 1/16
Tan Tan, green 2/16
Gametes A b a B Gray Gray, green 2/16
Gray Gray 1/16
Brown Brown 1/16
Brown Brown, tan 2/16
Brown Brown, gray 2/16
Brown Brown, gray, tan, green 4/16
F (all identical) Aa Bb Aa Bb
1
*This 1: 1: 2 : 2 : 1: 1: 2 : 2 : 4 F genotypic ratio corresponds to a
2
9 brown : 3 tan : 3 gray : 1 green F phenotypic ratio.
2
(c) Sorting out the dominance relations by select crosses
F 2 A B A b a B a b
Seed Coat Color of F Phenotypes and Ratio
2
Pure-Breeding Parents Frequencies
A B AA BB AA Bb Aa BB Aa Bb
9 A– B– (brown) Tan green 231 tan, 85 green 3 : 1
3 A– bb (tan) A b AA Bb AA bb Aa Bb Aa bb Gray green 2586 gray, 867 green 3:1
3 aa B– (gray) Brown gray 964 brown, 312 gray 3 :1
1 aa bb (green) a B Aa BB Aa Bb aa BB aa Bb Brown tan 255 brown, 76 tan 3 :1
Brown green 57 brown, 18 gray, 9 :3 : 3: 1
a b Aa Bb Aa bb aa Bb aa bb 13 tan, 4 green