
Page 18 - Genetics_From_Genes_to_Genomes_6th_FULL_Part1
P. 18
Guided Tour xvii
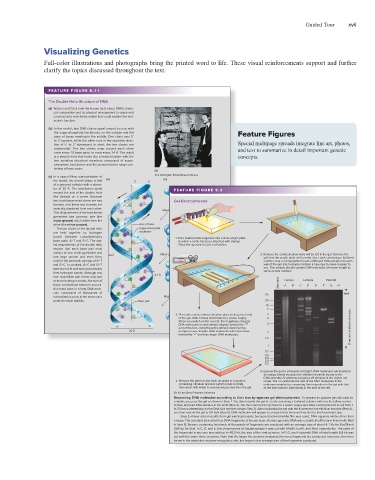
Visualizing Genetics
Full-color illustrations and photographs bring the printed word to life. These visual reinforcements support and further
clarify the topics discussed throughout the text.
6.2 The Watson and Crick Double Helix Model of DNA 191
FEATURE FIGURE 6.11
The Double Helix Structure of DNA
(a) Watson and Crick took the known facts about DNA’s chemi-
cal composition and its physical arrangement in space and
constructed a wire-frame model that could explain the mol-
ecule’s function.
(b) In the model, two DNA chains spiral around an axis with
the sugar-phosphate backbones on the outside and flat Feature Figures
pairs of bases meeting in the middle. One chain runs 5 ′
to 3′ upward, while the other runs in the opposite direc -
tion of 5′ to 3′ downward. In short, the two chains are Special multipage spreads integrate line art, photos,
antiparallel. The two chains wrap around each other and text to summarize in detail important genetic
once every 10 base pairs, or once every 34 Å. The result
is a double helix that looks like a twisted ladder with the concepts.
two spiraling structural members composed of sugar-
phosphate backbones and the perpendicular rungs con-
sisting of base pairs.
(a)
(c) In a space-filling representation of © A. Barrington Brown/Science Source
the model, the overall shape is that (b) 3' 5' (c)
of a grooved cylinder with a diame-
ter of 20 Å. The backbones spiral FEATURE FIGURE 9.3
around the axis of the double helix
like threads on a screw. Because
two backbones exist, there are two Gel Electrophoresis
threads, and these two threads are
vertically displaced from each other. Major groove
This displacement of the backbones
generates two grooves, one (the
major groove) much wider than the
other (the minor groove). Axis of helix
The two chains of the double helix Sugar-phosphate
are held together by hydrogen backbone
bonds between complementary 1. Pour heated molten agarose into a clear acrylic plate
base pairs, A–T and G–C. The spa- to which a comb has been attached with clamps.
tial requirements of the double helix Allow the agarose to cool and harden.
require that each base pair must
consist of one small pyrimidine and Minor groove Base pairs 2. Remove the comb; shallow wells will be left in the gel. Remove the
one large purine, and even then, 34 Å – + gel from the acrylic plate and transfer it to a tank containing a bu ered
only for the particular pairings of A–T solution. Use a micropipette to load a di erent DNA sample into each
and G–C. In contrast, A–C and G–T well of the gel. Each sample contains a blue dye to make it easier to
pairs do not fit well and cannot easily see. One sample should contain DNA molecules of known length to
form hydrogen bonds. Although any – – – – – serve as size markers.
one nucleotide pair forms only two 3.4 Å
or three hydrogen bonds, the sum of + + Human Lambda Plasmid
these connections between succes- + + Standard A B C D E F G H
sive base pairs in a long DNA mole- +
cule composed of thousands of Kb Well
nucleotides is a key to the molecule’s Major groove
great chemical stability. Base pair 20
10
7
3. The tank contains electrode wires placed along each end 5
of the gel. Attach these electrodes to a power supply. 4
When you switch on the current, the negatively charged 3
Base pairs
5' 3' DNA molecules in each sample migrate toward the “+” Direction of electrophoresis
end of the box, along the paths (lanes) shown by the
Sugar-phosphate backbones
20 Å orange arrows. Smaller DNA molecules will move faster 2
toward the “+” end than larger DNA molecules.
1.5
1
0.7
har00909_ch06_181-218.indd 191 5/12/17 9:21 PM 0.5
0.4
0.3
0.2
5. Expose the gel to ultraviolet (UV) light. DNA molecules will fluoresce
as orange bands because the ethidium bromide bound to the
DNA absorbs UV photons and gives o photons in the visible red
4. Remove the gel from the tank. Incubate in a solution range. You can estimate the size of the DNA molecules in the
containing ethidium bromide (which binds to DNA), unknown samples by comparing their migration in the gel with that
then wash with water to remove excess dye from the gel. of the size markers (standards) in the lane at the left.
(5): © Lee Silver, Princeton University
Separating DNA molecules according to their size by agarose gel electrophoresis. To prepare an agarose gel with wells for
samples, you pour the gel as shown in Step 1. You then transfer the gel to a tank containing a buffered solution with ions that allow current
to flow, and load DNA samples in the wells (Step 2). You then connect the gel tank to a power supply and allow electrophoresis to run from 1
to 20 hours (depending on the DNA size and the voltage; Step 3). After incubating the gel with the fluorescent dye ethidium bromide (Step 4),
you then expose the gel to UV light (Step 5). DNA molecules will appear as orange bands because they bind to the fluorescent dye.
Step 5 shows actual results from gel electrophoresis; because black-and-white film was used, DNA appears white rather than
orange. The standard lane at left has DNA fragments of known sizes. Human genomic DNA was cut with EcoRI in lane A and with RsaI
in lane B. Smears containing hundreds of thousands of fragments are produced with an average size of about 4.1 kb for EcoRI and
256 bp for RsaI. In C, D, and E, the chromosome of bacteriophage λ was cut with HindIII, EcoRI, and RsaI, respectively. The sizes of
the fragments in any one lane add up to 48.5 kb, the size of the viral genome. In F, G, and H plasmid DNA of total length 6.9 kb was
cut with the same three enzymes. Note that the larger the genome analyzed, the more fragments are produced; moreover, the more
bases in the restriction enzyme recognition site, the larger is the average size of the fragments produced.
321
har00909_ch09_316-340.indd 321 18/05/17 11:17 PM