Page 81 - Genetics_From_Genes_to_Genomes_6th_FULL_Part1
P. 81

3.3 Extensions to Mendel for Multifactorial Inheritance   73


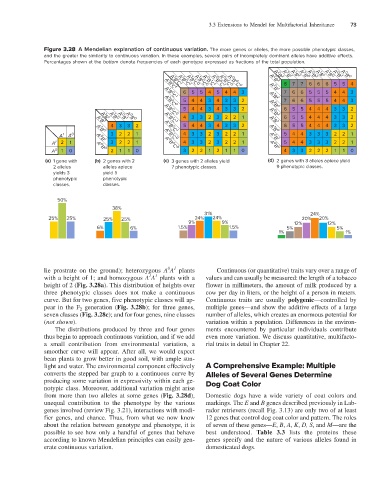
                       Figure 3.28  A Mendelian explanation of continuous variation. The more genes or alleles, the more possible phenotypic classes,
                       and the greater the similarity to continuous variation. In these examples, several pairs of incompletely dominant alleles have additive effects.
                       Percentages shown at the bottom denote frequencies of each genotype expressed as fractions of the total population.
                                                                                                  A  A    A  A       A  A
                                                                                                        1
                                                                                                                   1
                                                                                                                 1
                                                                                                   2  2  A B  2  0  A B  A B  0  0
                                                                                                A  B 2  B 1  2  B 0  B 2  1  0  B 1  B 0
                                                                    1
                                                                         1
                                                                 1  A B  1  A B A 0  A 0  A 0  A 0  2
                                                                  1
                                                                       1
                                                               1 A B C  0 A B C  0  B C B 0  B C B 0  B 2
                                                                                  1
                                                                             1
                                                                1  1 C 1  0  C 0  1  C 1  0  C 0  A 2  8  7  7  6  6  6  5  5  4
                                                              A B C
                                                                 1
                                                               1                                  B 1
                                                              A B
                                                                0   6  5  5  4  5  4  4  3        1  7  6  6  5  5  5  4  4  3
                                                                C 1                             A B
                                                               1                                   2
                                                                1   5  4  4  3  4  3  3  2      A    7  6  6  5  5  5  4  4  3
                                                                                                  2
                                                              A B C
                                                                 0                                B
                                                               1                                   0
                                                              A B
                                                                0   5  4  4  3  4  3  3  2      A 0  6  5  5  4  4  4  3  3  2
                                                                C
                                          1  A B A 0  A 0     A 0  0                              B 2
                                             1
                                           1  0  B  B               4  3  3  2  3  2  2  1           6  5  5  4  4  4  3  3  2
                                         A B
                                         1       1  0          B C                              A B
                                                                1
                                                                                                  1
                                        A B
                                          1                   A 0  1                               1
                                            4  3  3  2         B    5  4  4  3  4  3  3  2           6  5  5  4  4  4  3  3  2
                                                                                                  1
                                         1                      0                               A B
                                        A B
                                          0                   A  C                                 0
                                                               0  1
                            A 1  A 0    A 0  3  2  2  1        B C  4  3  3  2  3  2  2  1      A 0  5  4  4  3  3  3  2  2  1
                                                                1
                                         B 1                  A 0  0                              B 1
                         A 1 2  1       A 0  3  2  2  1        B 0  4  3  3  2  3  2  2  1      A 0  5  4  4  3  3  3  2  2  1
                                                                 C                                B
                                         B 0                      0                                0
                         A 0  1  0          2  1  1  0              3  2  2  1  2  1  1  0           4  3  3  2  2  2  1  1  0
                       (a)  1 gene with  (b)  2 genes with 2   (c)  3 genes with 2 alleles yield   (d)  2 genes with 3 alleles apiece yield
                          2 alleles       alleles apiece        7 phenotypic classes.             9 phenotypic classes.
                          yields 3        yield 5
                          phenotypic      phenotypic
                          classes.        classes.
                           50%
                                             38%
                                                                           31%                               24%
                        25%   25%         25%   25%                     24%   24%                          20%  20%
                                                                      9%         9%                     12%        12%
                                        6%         6%             1.5%             1.5%               5%              5%
                                                                                                   1%                    1%
                       lie prostrate on the ground); heterozygous  A A  plants   Continuous (or quantitative) traits vary over a range of
                                                               0 1
                       with a height of 1; and homozygous A A  plants with a   values and can usually be measured: the length of a tobacco
                                                         1 1
                       height of 2 (Fig. 3.28a). This distribution of heights over   flower in millimeters, the amount of milk produced by a
                       three phenotypic classes does not make a continuous   cow per day in liters, or the height of a person in meters.
                       curve. But for two genes, five phenotypic classes will ap-  Continuous  traits  are  usually  polygenic—controlled  by
                       pear in the  F 2  generation (Fig. 3.28b); for three genes,   multiple genes—and show the additive effects of a large
                       seven classes (Fig. 3.28c); and for four genes, nine classes   number of alleles, which creates an enormous potential for
                       (not shown).                                        variation within a population. Differences in the environ-
                          The distributions produced by three and four genes   ments encountered by particular individuals contribute
                       thus begin to approach continuous variation, and if we add   even more variation. We discuss quantitative, multifacto-
                       a small contribution from environmental variation, a   rial traits in detail in Chapter 22.
                       smoother curve will appear. After all, we would expect
                       bean plants to grow better in good soil, with ample sun-
                       light and water. The environmental component effectively   A Comprehensive Example: Multiple
                       converts the stepped bar graph to a continuous curve by   Alleles of Several Genes Determine
                       producing some variation in expressivity within each ge-  Dog Coat Color
                       notypic class. Moreover, additional variation might arise
                       from more than two alleles at some genes (Fig. 3.28d),   Domestic dogs have a wide variety of coat colors and
                       unequal contribution to the phenotype by the various   markings. The E and B genes described previously in Lab-
                       genes involved (review Fig. 3.21), interactions with modi-  rador retrievers (recall Fig. 3.13) are only two of at least
                       fier genes, and chance. Thus, from what we now know   12 genes that control dog coat color and pattern. The roles
                       about the relation between genotype and phenotype, it is   of seven of these genes—E, B, A, K, D, S, and M—are the
                       possible to see how only a handful of genes that behave   best understood.  Table 3.3  lists the proteins these
                       according to known Mendelian principles can easily gen-  genes specify and the nature of various alleles found in
                       erate continuous variation.                         domesticated dogs.
   76   77   78   79   80   81   82   83   84   85   86