
Page 39 - Genetics_From_Genes_to_Genomes_6th_FULL_Part1
P. 39
2.3 Mendelian Inheritance in Humans 31
TABLE 2.1 Some of the Most Common Single-Gene Traits in Humans
Disease Effect Incidence of Disease
Caused by a Recessive Allele
Thalassemia (chromosome 16 or 11) Reduced amounts of hemoglobin; 1/10 in parts of Italy
anemia, bone and spleen enlargement
Sickle-cell anemia (chromosome 11) Abnormal hemoglobin; sickle-shaped red 1/625 African-Americans
cells, anemia, blocked circulation;
increased resistance to malaria
Cystic fibrosis (chromosome 7) Defective cell membrane protein; 1/2000 Caucasians
excessive mucus production; digestive
and respiratory failure
Tay-Sachs disease (chromosome 15) Missing enzyme; buildup of fatty deposit 1/3000 Eastern European Jews
in brain that disrupts mental development
Phenylketonuria (PKU) (chromosome 12) Missing enzyme; mental deficiency 1/10,000 Caucasians
Caused by a Dominant Allele
Hypercholesterolemia (chromosome 19) Missing protein that removes cholesterol 1/122 French Canadians
from the blood; heart attack by age 50
Huntington disease (chromosome 4) Abnormal Huntingtin protein; progressive 1/25,000 Caucasians
mental and neurological damage;
neurologic disorders by ages 40–70
of a very large family. In this way, scientists can study the solely on the basis of the simple pedigree shown. The data
large numbers of genetically related individuals needed to are consistent with both possibilities. If the trait is domi-
establish the inheritance patterns of specific traits. A fam- nant, then the father and the affected son are heterozygotes,
ily history, known as a pedigree, is an orderly diagram of a while the mother and the unaffected son are homozygotes
family’s relevant genetic features, extending back to at least for the recessive normal allele. If instead the trait is reces-
both sets of grandparents and preferably through as many sive, the father and affected son are homozygotes for the
additional generations as possible. From systematic pedi- recessive disease-causing allele, while the mother and the
gree analysis in the light of Mendel’s laws, geneticists unaffected son are heterozygotes.
can tell if a trait is determined by alternative alleles of a Several kinds of additional information could help re-
single gene and whether a single-gene trait is dominant solve this uncertainty. Human geneticists would particularly
or recessive. Because Mendel’s principles are so simple want to know the frequency at which the trait in question is
and straightforward, a little logic can go a long way in found in the population from which the family came. If the
explaining how traits are inherited in humans. trait is rare in the population, then the allele giving rise to
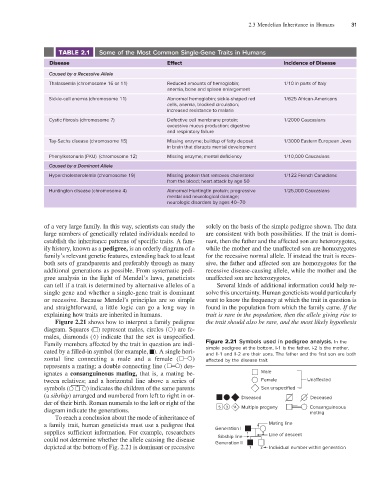
Figure 2.21 shows how to interpret a family pedigree the trait should also be rare, and the most likely hypothesis
diagram. Squares ( ) represent males, circles ( ) are fe-
males, diamonds ( ) indicate that the sex is unspecified.
Family members affected by the trait in question are indi- Figure 2.21 Symbols used in pedigree analysis. In the
cated by a filled-in symbol (for example, ). A single hori- simple pedigree at the bottom, I-1 is the father, I-2 is the mother,
and II-1 and II-2 are their sons. The father and the first son are both
zontal line connecting a male and a female ( ) affected by the disease trait.
represents a mating; a double connecting line ( ) des-
ignates a consanguineous mating, that is, a mating be- Male
tween relatives; and a horizontal line above a series of Female Unaected
symbols ( ) indicates the children of the same parents Sex unspecified
(a sibship) arranged and numbered from left to right in or- Diseased Deceased
der of their birth. Roman numerals to the left or right of the
diagram indicate the generations. 5 3 14 Multiple progeny Consanguineous
mating
To reach a conclusion about the mode of inheritance of
a family trait, human geneticists must use a pedigree that Generation I Mating line
supplies sufficient information. For example, researchers 1 2 Line of descent
Sibship line
could not determine whether the allele causing the disease Generation II
depicted at the bottom of Fig. 2.21 is dominant or recessive 1 2 Individual number within generation