
Page 163 - Genetics_From_Genes_to_Genomes_6th_FULL_Part1
P. 163
5.4 The Chi-Square Test and Linkage Analysis 155
TOOLS OF GENETICS Blue DNA: © MedicalRF.com
The Chi-Square Test for Goodness of Fit
The general protocol for using the chi-square test for goodness of 4. Next, you consider the degrees of freedom (df). The df is
fit and evaluating its results can be stated in a series of steps. Two a measure of the number of independently varying pa-
preparatory steps precede the actual chi-square calculation. rameters in the experiment (see text). The value of de-
grees of freedom is one less than the number of classes.
1. Use the data obtained from a breeding experiment to an- Thus, if N is the number of classes, then the degrees of
swer the following questions: freedom (df) = N − 1. If there are four classes, then there
a. What is the total number of offspring (events) analyzed? are 3 df.
b. How many different classes of offspring (events) are 5. Use the chi-square value together with the df to deter-
present? mine a p value: the probability that a deviation from the
c. In each class, what is the number of offspring (events) predicted numbers at least as large as that observed in
observed? the experiment would occur by chance. Although the p
2. Calculate how many offspring (events) would be expected value is arrived at through a numerical analysis, geneti-
for each class if the null hypothesis (here, no linkage) cists routinely determine the value by a quick search
were correct. To do so, multiply the fraction predicted by through a table of critical χ values for different degrees
2
the null hypothesis (here, 1/4 of each possible progeny of freedom, such as Table 5.2.
type) by the total number of offspring. You are now ready 6. Evaluate the significance of the p value. You can think of
for the chi-square calculation. the p value as the probability that the null hypothesis is
3. To calculate chi square, begin with one class of offspring. true. A value greater than 0.05 indicates that in more than
Subtract the expected number from the observed number 1 in 20 (or more than 5%) repetitions of an experiment of
to obtain the deviation from the predicted value for the the same size, the observed deviation from predicted val-
class. Square the result and divide this value by the ues could have been obtained by chance, even if the null
expected number. hypothesis is actually true; the data are therefore not sig-
Do this procedure for all classes and then sum the nificant for rejecting the null hypothesis. Statisticians have
2
individual results. The final result is the chi-square (χ ) arbitrarily selected the 0.05 p value as the boundary
value. This step is summarized by the equation:
between rejecting or not rejecting the null hypothesis.
(Number observed − Number expected) 2 A p value of less than 0.05 means that you can consider
2
χ = Σ the deviation to be significant, and you can reject the
Number expected null hypothesis.
where Σ means sum of all classes.
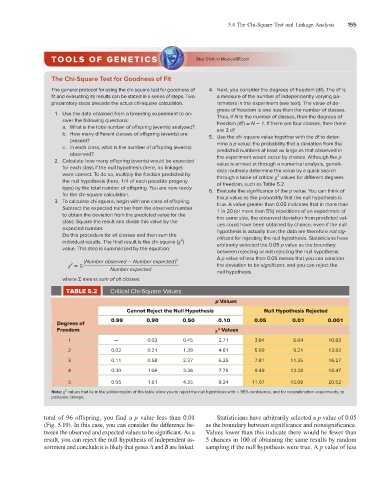
TABLE 5.2 Critical Chi-Square Values
p Values
Cannot Reject the Null Hypothesis Null Hypothesis Rejected
Degrees of 0.99 0.90 0.50 0.10 0.05 0.01 0.001
2
Freedom χ Values
1 — 0.02 0.45 2.71 3.84 6.64 10.83
2 0.02 0.21 1.39 4.61 5.99 9.21 13.82
3 0.11 0.58 2.37 6.25 7.81 11.35 16.27
4 0.30 1.06 3.36 7.78 9.49 13.28 18.47
5 0.55 1.61 4.35 9.24 11.07 15.09 20.52
2
Note: χ values that lie in the yellow region of this table allow you to reject the null hypothesis with > 95% confidence, and for recombination experiments, to
postulate linkage.
total of 96 offspring, you find a p value less than 0.01 Statisticians have arbitrarily selected a p value of 0.05
(Fig. 5.19). In this case, you can consider the difference be- as the boundary between significance and nonsignificance.
tween the observed and expected values to be significant. As a Values lower than this indicate there would be fewer than
result, you can reject the null hypothesis of independent as- 5 chances in 100 of obtaining the same results by random
sortment and conclude it is likely that genes A and B are linked. sampling if the null hypothesis were true. A p value of less