
Page 171 - Genetics_From_Genes_to_Genomes_6th_FULL_Part1
P. 171
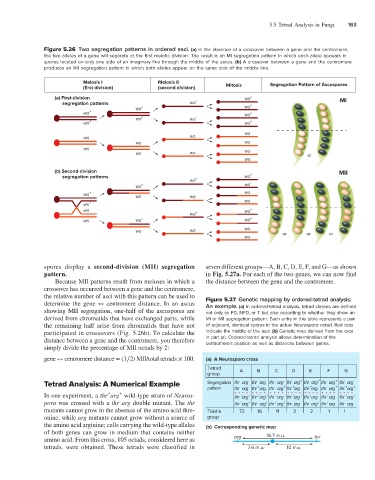
5.5 Tetrad Analysis in Fungi   163


                       Figure 5.26  Two segregation patterns in ordered asci. (a) In the absence of a crossover between a gene and the centromere,
                       the two alleles of a gene will separate at the first meiotic division. The result is an MI segregation pattern in which each allele appears in
                       spores located on only one side of an imaginary line through the middle of the ascus. (b) A crossover between a gene and the centromere
                       produces an MII segregation pattern in which both alleles appear on the same side of the middle line.

                                   Meiosis I                Meiosis II                           Segregation Pattern of Ascospores
                                   (first division)          (second division)      Mitosis
                          (a) First-division                                            ws +                            MI
                                segregation patterns                  ws +                +
                                                    ws +                                ws
                                   ws +                                                 ws +
                                                    ws +              ws +
                                   ws +                                                 ws +
                                                                                        ws
                                   ws                                 ws
                                                    ws                                  ws
                                   ws                                                   ws
                                                    ws                ws                                     or
                                                                                        ws

                          (b) Second-division                                                                          MII
                                segregation patterns                    +               ws +
                                                                      ws                  +
                                                    ws +                                ws
                                   ws +             ws                ws                ws

                                   ws +                                                 ws
                                   ws                                   +               ws +
                                                                      ws
                                   ws               ws +                                ws +
                                                    ws                ws                ws          or      or      or
                                                                                        ws


                       spores display a  second-division (MII) segregation   seven different groups—A, B, C, D, E, F, and G—as shown
                       pattern.                                            in Fig. 5.27a. For each of the two genes, we can now find
                          Because MII patterns result from meioses in which a   the distance between the gene and the centromere.
                       crossover has occurred between a gene and the centromere,
                       the relative number of asci with this pattern can be used to   Figure 5.27  Genetic mapping by ordered-tetrad analysis:
                       determine the gene ↔ centromere distance. In an ascus   An example. (a) In ordered-tetrad analysis, tetrad classes are defined
                       showing MII segregation, one-half of the ascospores are   not only as PD, NPD, or T but also according to whether they show an
                       derived from chromatids that have exchanged parts, while   MI or MII segregation pattern. Each entry in this table represents a pair
                       the remaining half arise from chromatids that have not   of adjacent, identical spores in the actual Neurospora octad. Red dots
                       participated in crossovers (Fig. 5.26b). To calculate the   indicate the middle of the asci. (b) Genetic map derived from the data
                       distance between a gene and the centromere, you therefore   in part (a). Ordered-tetrad analysis allows determination of the
                                                                           centromere’s position as well as distances between genes.
                       simply divide the percentage of MII octads by 2:
                       gene ↔ centromere distance = (1∕2) MII/total tetrads × 100.  (a)  A Neurospora cross
                                                                            Tetrad    A     B     C    D     E     F     G
                                                                            group
                                                                                                                      +
                                                                                                                +
                       Tetrad Analysis: A Numerical Example                 Segregation thr  arg  thr  arg  thr  arg thr  arg +  thr  arg thr  arg thr   arg
                                                                                                                      +
                                                                            pattern  thr  arg  thr arg  thr  arg thr + arg  thr arg thr  arg thr + arg +
                                                                                                             +
                                                                                                     +
                                                                                            +
                                           +
                                               +
                       In one experiment, a thr arg  wild-type strain of Neuros-     thr arg +  thr arg + thr arg thr + arg +  thr arg thr arg thr + arg +
                                                                                                             +
                                                                                                  +
                                                                                            +
                                                                                       +
                                                                                                                   +
                       pora was crossed with a thr arg double mutant. The thr        thr arg +  thr arg +  thr arg thr   arg  thr  arg thr arg thr   arg
                                                                                                     +
                                                                                                                   +
                                                                                                                +

                                                                                       +
                                                                                                  +
                       mutants cannot grow in the absence of the amino acid thre-  Total in  72          16           11           2           2            1           1
                       onine, while arg mutants cannot grow without a source of   group
                       the amino acid arginine; cells carrying the wild-type alleles   (b)  Corresponding genetic map
                       of both genes can grow in medium that contains neither
                       amino acid. From this cross, 105 octads, considered here as   arg       16.7 m.u.       thr
                       tetrads, were obtained. These  tetrads were  classified in        7.6 m.u.     10 m.u.